

Quick answer: A multi-entity chart of accounts becomes difficult to manage when each entity maintains its own account structure and reporting dimensions such as departments, locations, projects, events, and grants are built as general ledger accounts. The better approach is a standardized, shared chart of accounts with dimensional reporting layered on top.
For growing multi-entity organizations, that structural change can simplify consolidated financial reporting, reduce manual reconciliation, and create the foundation for a faster month-end close.
One Fourlane client came to the team after years on Microsoft Dynamics GP with 2,402 accounts. Their profit and loss statement had become so long that the finance team had effectively stopped using it. After roughly two hours of focused chart of accounts cleanup, the structure was reduced to fewer than 250 accounts while preserving the financial detail leadership needed.
This article draws on examples discussed during Fourlane’s From Chaos to Clarity multi-entity accounting session with Intuit and explains why account structures become bloated, how dimensions solve the problem, and why chart of accounts design directly affects multi-entity month-end close performance.
- Why multi-entity charts of accounts break
- Signs your chart of accounts needs cleanup
- Dimensions vs. chart of accounts
- Why multi-entity businesses need a shared chart of accounts
- How your chart of accounts affects month-end close
- Before and after multi-entity standardization
- The migration trap
- How to clean up a multi-entity chart of accounts
- Frequently asked questions
Why Multi-Entity Charts of Accounts Break
No accounting team deliberately sets out to create thousands of GL accounts. The problem usually develops gradually.
Leadership wants to track something new, such as an event, department, location, project, grant, or product line. The accounting system offers an obvious place to track it, so someone creates another GL account.
Then another department needs a variation. Another entity creates its own version. Another company uses a slightly different account number.
Multiply that pattern across five, seven, or more legal entities and the organization can end up with thousands of accounts, inconsistent financial structures, and reports that become difficult to use.
This is not specific to Microsoft Dynamics GP. During the same session, Fourlane discussed an organization migrating from NetSuite whose chart of accounts had been designed for a significantly larger business. After a divestiture, the structure no longer matched the organization. Right-sizing reduced the account list to roughly 100 to 150 accounts.
The underlying problem is the same: flexibility in the accounting system makes it possible to put too much reporting detail into the chart of accounts.
Signs Your Chart of Accounts Needs Cleanup
Your chart of accounts should make financial reporting easier. When the structure itself creates reporting work, cleanup is usually overdue.
- Your profit and loss statement is so long that users rarely review the entire report.
- Each entity maintains a different version of the same account.
- Your accounting team keeps a separate reference sheet showing which accounts are actually in use.
- Consolidation requires exporting financial data to Excel and manually combining reports.
- You have GL accounts named after departments, locations, projects, grants, events, or similar reporting categories.
- Account numbering and naming conventions differ significantly between entities.
- Users regularly create new accounts because they cannot determine where transactions belong.
If several of these problems apply, the chart of accounts may be one of the primary bottlenecks in your reporting process.
Dimensions vs. Chart of Accounts: The Distinction That Fixes the Problem
The key to simplifying a multi-entity chart of accounts is separating financial accounts from reporting dimensions.
A GL account identifies what happened financially. A dimension provides additional context about where, why, or for whom the transaction occurred.
| Reporting Element | Purpose | Examples |
|---|---|---|
| GL account | Identifies the financial nature of a transaction. | Revenue, wages, rent expense, cost of goods sold |
| Dimension | Identifies the business context surrounding the transaction. | Department, entity, location, project, grant, event, product line |
For example, you may need one revenue account rather than creating separate revenue accounts for every department and location. The transaction can use the appropriate revenue account while dimensions identify the department, location, project, or other reporting attribute.
This keeps the chart of accounts manageable while preserving detailed reporting.
Why Dimensional Reporting Matters
Intuit Enterprise Suite (Intuit ERP) supports dimensional reporting so organizations can analyze financial activity across areas such as entities, departments, locations, projects, product lines, and other business dimensions without forcing all of that detail into the GL account structure.
The result is a shorter and more understandable chart of accounts with more flexible management reporting.
Fourlane’s Intuit Enterprise Suite consulting services include chart of accounts and dimensional reporting design for organizations preparing to implement or optimize the platform.
Why Multi-Entity Businesses Need a Shared Chart of Accounts
The second major problem is inconsistency between legal entities.
When each entity manages its chart of accounts independently, similar accounts begin to diverge. One company may use a different account name, number, hierarchy, or classification than another.
Those differences eventually appear during consolidation.
Intuit Enterprise Suite supports a shared chart of accounts across entities under a parent organization. Instead of maintaining separate account lists, finance teams can manage the structure from a common control point and determine which entities use each account.
- Add accounts once: Create an account within the shared structure and assign it where needed.
- Standardize account maintenance: Manage cleanup and account governance from a central structure.
- Keep hierarchies aligned: Standardize parent accounts, subaccounts, naming, and numbering across entities.
- Improve consolidation: Consistent underlying structures make consolidated reporting easier to automate.
- Reduce future account sprawl: Finance teams have a common framework for deciding when a new account is actually necessary.
Clean the structure once and maintain it consistently across the organization.
How Your Chart of Accounts Affects the Month-End Close
A messy chart of accounts is not merely an administrative inconvenience. It can directly increase the amount of work required during month-end close.
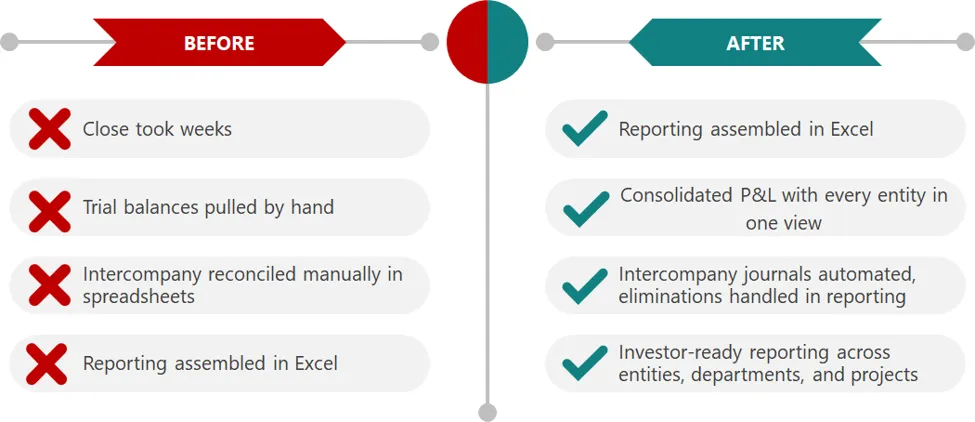
Consider a Fourlane client consisting of seven companies across equipment leasing, aviation, and investment holdings. The organization was preparing to take on outside investment, but its close process was taking weeks.
The finance team manually pulled trial balances, reconciled intercompany activity by hand, and assembled consolidated reporting in spreadsheets. Leadership needed investor-ready reporting, but finance was spending much of its time assembling the numbers instead of analyzing them.
The problem traced back to financial structure. When entities use inconsistent account structures, financial data does not roll up cleanly. Finance teams compensate by rebuilding consolidation logic manually each month.
Intercompany Accounting Adds Another Layer
Multi-entity organizations also need a consistent method for recording transactions between related entities.
In Intuit Enterprise Suite, dedicated intercompany workflows can post both sides of an intercompany transaction and support eliminations during consolidated reporting. This reduces the amount of manual reconciliation required at month-end.
AI-assisted error and anomaly detection can also help identify issues before they become larger reconciliation problems.
The goal is straightforward: finance teams should spend less time assembling financial data and more time using it.
Before and After Multi-Entity Accounting Standardization
The before-and-after example from the session shows how structural changes can affect the close and consolidated financial reporting process.
| Before | After |
|---|---|
| Month-end close took weeks. | The close was reduced to about 10 business days. |
| Trial balances were pulled manually. | Financial data became easier to consolidate within the system. |
| Intercompany activity was reconciled manually in spreadsheets. | Intercompany workflows and eliminations became more automated. |
| Consolidated reporting was assembled manually. | Leadership gained consolidated reporting across entities and other reporting dimensions. |
A cleaner chart of accounts was not the only change involved, but standardized financial structure was an important prerequisite for making those workflows work effectively.
The Chart of Accounts Migration Trap
A new ERP system does not automatically fix an old chart of accounts.
If an organization migrates thousands of poorly structured accounts into a new platform, it simply relocates the problem. The business may have newer technology while still producing the same unreadable financial reports.
The Fourlane client that reduced its chart from 2,402 accounts to fewer than 250 did not accomplish that through an automatic software feature. The improvement came from redesigning the accounting structure and deciding which items were true GL accounts and which should be handled as dimensions.
That distinction should be made before migration whenever possible.
Do Not Treat Data Migration as a Copy-and-Paste Project
A strong ERP migration should evaluate the structure of the data being moved, not simply transfer everything exactly as it exists today.
That includes reviewing:
- Chart of accounts structure
- Parent and subaccount relationships
- Entity-specific accounts
- Inactive and duplicate accounts
- Department and location tracking
- Project, grant, event, and product reporting
- Intercompany workflows
- Historical data requirements
- Financial reporting structure
- Internal controls and account governance
Fourlane’s Intuit Enterprise Suite implementation and consulting team works with businesses on system design, chart of accounts cleanup, dimensional reporting, data migration, intercompany workflows, internal controls, training, and go-live planning.
How to Clean Up a Multi-Entity Chart of Accounts
A successful chart of accounts cleanup should reduce unnecessary complexity without eliminating useful financial detail.
- Inventory your current accounts: Identify every active, inactive, duplicate, and entity-specific account across the organization.
- Identify duplicate accounts: Look for accounts that serve the same purpose but use different names or numbers between entities.
- Separate accounts from dimensions: Review departments, locations, projects, grants, events, product lines, and similar categories that may belong in dimensional reporting instead.
- Define a standardized account structure: Establish consistent naming, numbering, account types, parent accounts, and subaccounts.
- Create the shared chart of accounts: Determine the master account list and identify which entities need access to each account.
- Design reporting dimensions: Build dimensions around the ways leadership actually analyzes business performance.
- Map legacy data: Decide where existing accounts and transactions will belong before migration begins.
- Standardize intercompany processes: Define how related entities record, reconcile, and eliminate intercompany transactions.
- Test consolidated financial reporting: Validate entity reporting, consolidated profit and loss statements, balance sheets, dimensional views, and eliminations before go-live.
- Create account governance rules: Document when finance users should create a GL account and when they should use an existing account with a reporting dimension.
Multi-Entity Chart of Accounts FAQs
How Many Accounts Should a Chart of Accounts Have?
There is no universal number that works for every organization. In the client examples discussed during the Fourlane and Intuit session, cleaned-up mid-market charts of accounts ranged from roughly 100 to 250 accounts.
The more useful question is whether each GL account represents a legitimate financial category or whether some accounts exist only to track departments, locations, projects, events, grants, or other dimensions.
What Is the Difference Between a Dimension and a GL Account?
A GL account describes the financial nature of a transaction, such as revenue, wages, rent expense, or cost of goods sold. A dimension describes business context, such as the department, location, project, grant, event, entity, or product line associated with the transaction.
Separating the two keeps the chart of accounts manageable while preserving detailed reporting.
Can Multiple Entities Share One Chart of Accounts?
Yes. Intuit Enterprise Suite supports a shared chart of accounts across entities under a parent organization. Finance teams can maintain the account structure centrally while identifying which entities use particular accounts.
This consistency supports consolidated financial reporting and more standardized intercompany accounting.
How Long Does a Chart of Accounts Cleanup Take?
The timeline depends on the size, complexity, and condition of the existing account structure. In the example discussed during the session, an experienced consultant reduced a chart of accounts from 2,402 entries to fewer than 250 in roughly two hours of focused cleanup work.
More complex organizations may require additional time for account mapping, dimensional design, entity standardization, reporting validation, and migration planning.
Will Cleaning Up the Chart of Accounts Speed Up Month-End Close?
It can remove one of the structural barriers to a faster close. When entities use inconsistent account structures, consolidation often depends on manual spreadsheets and reconciliation.
Standardizing the chart of accounts, dimensional reporting, and intercompany processes allows more of the consolidation process to happen inside the accounting system. In the client example discussed above, the organization reduced its close from weeks to about 10 business days after restructuring its processes and moving to Intuit Enterprise Suite.
Should You Clean Up the Chart of Accounts Before an ERP Migration?
Yes, whenever possible. Migrating an outdated or bloated chart of accounts can recreate the same reporting problems in the new ERP system. Reviewing accounts, dimensions, entity structures, and reporting requirements before migration creates a cleaner foundation for the new platform.
Related Reading
- How Multi-Entity Businesses Close the Books Faster with Intuit Enterprise Suite
- Intuit Enterprise Suite Consulting Services
- What Is Intuit Enterprise Suite?
Ready to Simplify Your Multi-Entity Chart of Accounts?
A cleaner chart of accounts can improve consolidated reporting, reduce manual reconciliation, and create a stronger foundation for a faster month-end close.
Talk with Fourlane’s Intuit Enterprise Suite consultants about your current accounting structure, dimensional reporting requirements, intercompany workflows, and ERP migration strategy.
- Chart of accounts cleanup and standardization
- Multi-entity and dimensional reporting design
- Intercompany accounting and consolidation workflows
- Intuit Enterprise Suite implementation and data migration
- Training, internal controls, and ongoing support