

As businesses grow, operational complexity grows with them. Sales teams process orders in one system, warehouse teams track inventory in another, and finance closes the books somewhere else entirely. When operational data lives in separate systems, leadership teams lose visibility. Even well-run organizations end up spending too much time reconciling reports and not enough time acting on them.
That is why sales and inventory visibility is so important. It is also why Intuit Enterprise Suite (IES) has become an important solution for growing organizations that have outgrown disconnected workflows.
By bringing sales activity, inventory movement, and financial reporting together in one platform, Intuit Enterprise Suite helps businesses see how daily operations influence profitability, cash flow, and strategic decision-making.
As I explained during a recent webinar: “Everything begins with customer demand. That demand appears in the system as sales orders. Once those orders are fulfilled, inventory moves out of stock.”
That movement triggers cost recognition and begins to appear in financial reporting through revenue, margins, and profitability metrics. When these operational and financial signals are connected, businesses can move from raw activity to meaningful insight much faster.
Why Sales and Inventory Visibility Matters for Growing Businesses
Sales activity and inventory movement create the earliest signals of business performance.
| Sales reporting reveals: | Inventory reporting reveals: |
|
|
When businesses can see both demand and operational response, they can make smarter decisions earlier.
For example:
- Strong sales demand combined with low inventory may signal the need to increase purchasing or production.
- Rising inventory levels paired with slowing sales may indicate potential stock risk.
Without clear visibility, these signals often appear only after the reporting period closes. With connected systems, teams can detect and respond to changes while the period is still in progress.
The Operational Signal Loop: Sales, Inventory, and Finance
One of the most important ideas behind Intuit Enterprise Suite is the operational signal loop.
Business activity follows a predictable path:
- Customer demand appears as a sales order
- The order is fulfilled and inventory moves out of stock
- The system recognizes cost of goods sold
- Financial reports reflect revenue, margins, and profitability
In other words, financial reports are the financial reflection of operational activity.
When sales systems, inventory tracking, and accounting platforms are disconnected, this relationship becomes difficult to see. Leaders may review financial results without fully understanding the operational decisions behind them.
By connecting these systems, Intuit Enterprise Suite allows organizations to follow transactions from customer demand all the way to financial reporting. 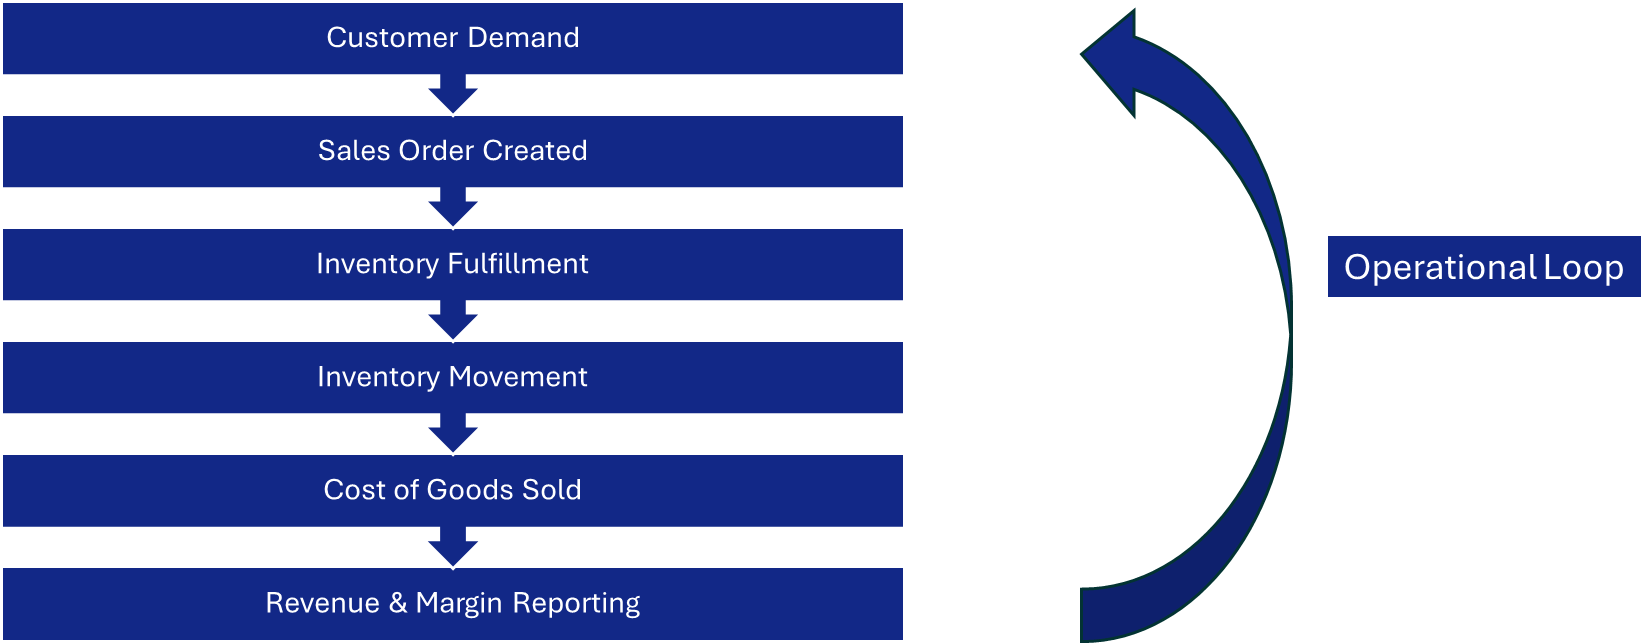
Building the Data Foundation for Accurate Reporting
Reliable reporting does not begin with dashboards or analytics tools. It begins with the quality and consistency of operational data.
Sales and inventory reporting depend heavily on several foundational elements:
- Product categorization
- Inventory location tracking
- Receiving workflows
- Inventory cost valuation methods
When these elements are standardized across the organization, reporting becomes easier to interpret, and leadership can make decisions with greater confidence.
Standardizing Product Categories
Product categorization determines how businesses analyze product performance. When items are organized consistently, teams can easily compare:
- Revenue by product line
- Profitability by category
- Demand patterns across customer segments
Without consistent item structures, reports quickly become confusing. Duplicate records, inconsistent naming conventions, and mismatched item categories can distort trend analysis and margin reporting.
Standardizing item categories helps organizations maintain clean reporting as product catalogs grow.
Tracking Inventory Locations Accurately
Inventory location tracking is equally important for organizations operating multiple warehouses, storage areas, or job sites.
When inventory is distributed across locations, teams need clear visibility into:
- Where items are stored
- How much inventory is available
- Whether shortages are real or simply hidden in another location
Without accurate location tracking, businesses may reorder inventory they already have or miss opportunities to transfer stock between facilities.
Standardized location records help prevent unnecessary purchasing and support more efficient fulfillment operations.
Aligning Receiving Workflows and Cost Methods
Receiving processes play a major role in inventory accuracy.
If goods arrive physically but the receiving transaction is recorded later, reports may temporarily show less inventory than the business actually has. This can distort reorder decisions and fulfillment expectations.
The opposite problem can occur as well. If receipts are entered too early or with incorrect quantities, inventory may appear available before it can actually be picked or shipped.
These timing gaps create operational confusion and can lead to:
- Stockouts
- Duplicate purchasing
- Customer service delays
Consistent receiving workflows help ensure that inventory levels accurately reflect what is happening in the warehouse.
Inventory cost valuation methods are equally important on the financial side. The way inventory is valued affects:
- Cost of goods sold (COGS)
- Gross margin calculations
- Profitability reporting
When cost methods are applied consistently, financial reports remain reliable and easier to reconcile.
Understanding Sales Trends Before Financial Results Change
Sales trend analysis provides valuable insight into changing demand patterns.
Rather than focusing only on total revenue, leaders should evaluate:
- Product-level demand trends
- Customer purchasing patterns
- Margin changes across products
These insights help organizations respond earlier to shifts in demand.
For example:
- Product sales volume stayed the same while margin dropped from roughly 25% to 17%
- This signal suggest an operational change rather than a demand problem.
- Possible explanations could include rising supplier costs, increased freight expenses, or pricing adjustments that failed to keep pace with cost increases.
In another example:
- Sales volume declined significantly while margin remained stable.
- This pattern suggests demand had changed, not pricing or cost structure.
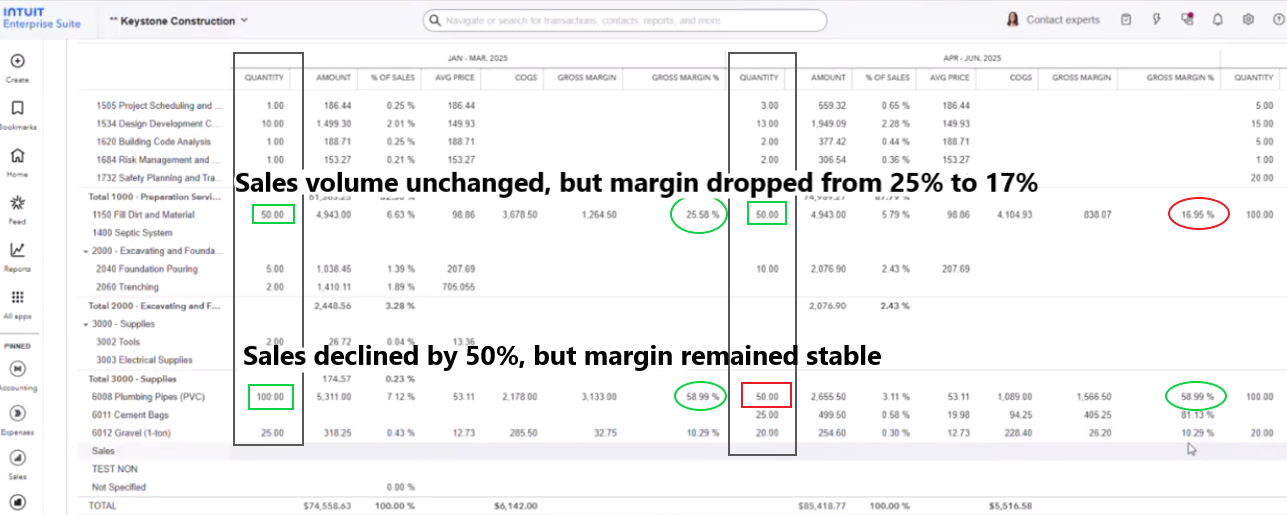
These kinds of insights help teams ask better questions and investigate the right operational drivers behind financial changes.
Inventory Visibility and Working Capital Management
Inventory represents both operational capacity and financial investment.
Businesses depend on inventory to fulfill orders and maintain production. At the same time, inventory sits on the balance sheet as an asset and ties up working capital.
Monitoring inventory movement helps organizations understand whether stock levels align with real customer demand.
Three inventory patterns are especially important to track:
- Fast-Moving Inventory: Fast-moving items often signal strong customer demand. Businesses may need to increase purchasing or replenishment frequency to avoid stockouts.
- Aging Inventory: Inventory that sits in stock for extended periods can indicate slow demand, excess purchasing, or inaccurate forecasting. Aging inventory ties up cash and increases the risk of markdowns.
- Inventory Growth Outpacing Sales: If inventory levels rise faster than sales demand, the organization may be over-ordering or misreading market trends.
Monitoring these patterns helps leadership balance operational readiness with effective cash management.
Identifying Process Issues Through Inventory Signals
Inventory reports often reveal operational issues that might otherwise go unnoticed.
One common example is negative quantity on hand, which typically means a product was sold before it was recorded as received. As I explained in my webinar, “This typically means that the item was sold before it was received in inventory.” Negative inventory often points to timing problems in the order-to-receipt-to-fulfillment process.
Possible causes include:
- Delayed receiving entries
- Early invoicing
- Missing transfers or adjustments
These issues can create confusion across departments. Sales teams may believe inventory is unavailable when it has actually arrived. Purchasing teams may reorder stock unnecessarily. Warehouse teams may spend time investigating discrepancies.
Correcting these issues usually involves reviewing receiving procedures, fulfillment timing, and transaction entry processes.
Connecting Operational Activity to Financial Reporting
One of the most valuable features of Intuit Enterprise Suite is the ability to follow transactions from operational activity to financial impact.
The process typically looks like this:
- A customer places an order and the business creates a sales order.
- The order is fulfilled and converted to an invoice.
- Revenue is recognized and inventory quantity decreases.
- The system records cost of goods sold, affecting profitability.
In one example demonstrated during the webinar, converting a sales order to an invoice reduced inventory by 20 units and generated a $3,700 sale. That single operational action simultaneously affected:
- Inventory levels
- Revenue reporting
- Cost of goods sold
- Profitability metrics
Understanding this connection allows leadership teams to trace financial outcomes back to operational activity.
Monitoring Performance with KPI Dashboards
Most organizations monitor performance through KPI dashboards or scorecards that combine metrics across sales, operations, and finance.
Common metrics include:
| Sales KPIs | Inventory KPIs | Financial KPIs |
|
|
|
By reviewing these signals together, leadership teams gain a more complete view of business performance.
For example, revenue growth paired with declining margins may indicate rising costs. Increasing inventory paired with flat sales may signal purchasing or forecasting issues. KPI dashboards help teams identify these patterns quickly.

Using AI to Identify Financial Trends Faster
AI-assisted reporting tools within Intuit Enterprise Suite help organizations analyze operational signals more efficiently.
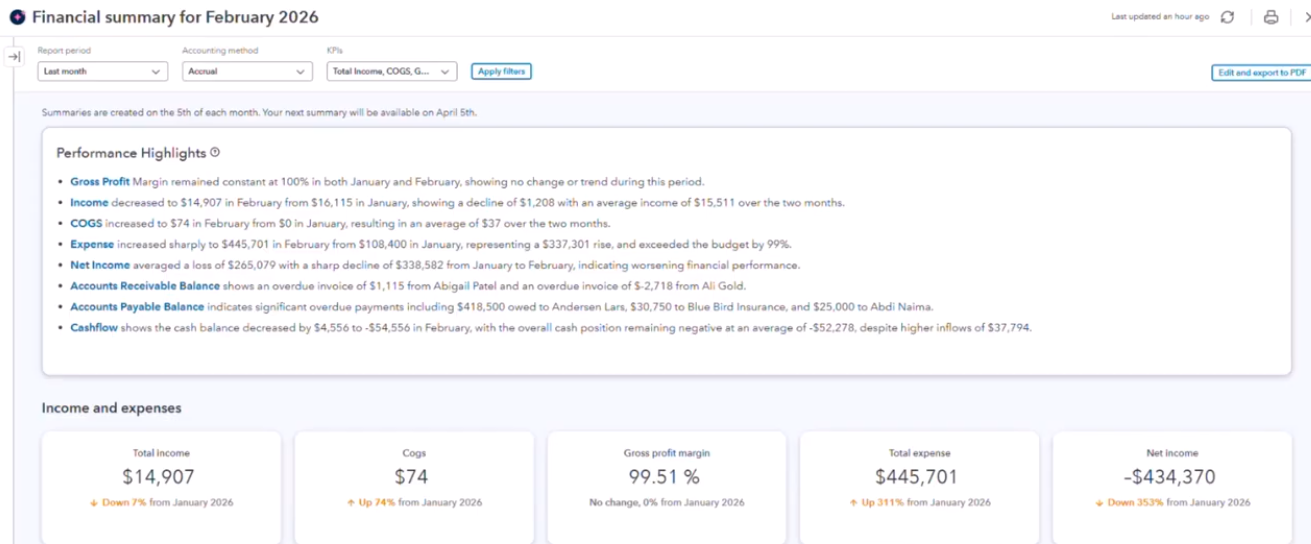
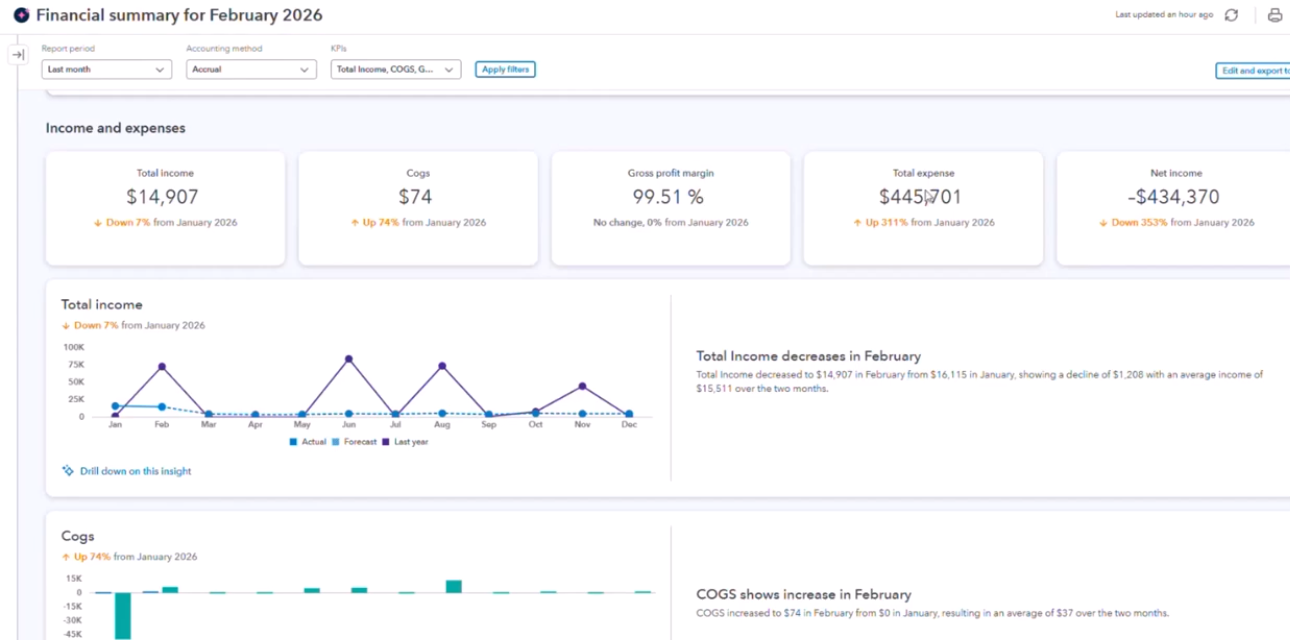
These tools can:
- Generate automated financial summaries
- Highlight unusual changes in revenue or expenses
- Identify trends across sales and inventory activity
- Surface variances that may require investigation
Instead of manually reviewing multiple reports, teams receive summaries that highlight the most important changes in the reporting period.
This does not replace human analysis. Instead, it helps leaders focus their attention on the transactions and trends that matter most.
For multi-entity organizations or businesses with multiple locations, AI-assisted insight can also provide consolidated performance views while still allowing users to drill down into operational detail.
Turning Visibility into Better Business Decisions
Sales activity, inventory movement, and financial reporting are deeply interconnected.
Sales orders provide early signals of customer demand. Inventory movement reflects how the organization responds operationally. Financial reports reveal the ultimate impact on profitability.
When these signals exist in separate systems, leadership often reacts to changes too late. When they are connected within a unified platform, teams can detect trends earlier and respond more effectively.
Better visibility helps organizations:
- Respond faster to demand changes
- Manage inventory more effectively
- Improve margin control
- Strengthen financial reporting
At Fourlane, we help businesses build that visibility by aligning operational processes with scalable financial systems. Our team works with organizations to improve reporting accuracy, strengthen financial workflows, and evaluate when solutions like Intuit Enterprise Suite are the right next step.
If your organization is exploring Intuit Enterprise Suite and wants to understand how it fits your growth goals, reporting requirements, and operational complexity, contact Fourlane for a free consultation. We can help you assess your current systems and design a clear path toward better visibility and stronger financial decision-making.
Ready to Improve Sales and Inventory Visibility?
If disconnected systems are making it harder to track sales, manage inventory, and understand profitability, it may be time for a more scalable financial operations platform. Intuit Enterprise Suite can help growing businesses connect operational data with financial reporting so leadership can make faster, more informed decisions.
Contact Fourlane to talk with a QuickBooks and Intuit Enterprise Suite expert about your reporting challenges, operational workflows, and growth goals.
- Evaluate whether Intuit Enterprise Suite is the right fit for your business
- Improve visibility across sales, inventory, and financial reporting
- Strengthen workflows, reporting accuracy, and decision-making